There are many data sets surrounding movies and film production. This data typically contains lots of useful information regarding the title, genre, and production studio. Along with these variables, information such as original budget and gross revenue, overall popularity and release date make it possible to analyse and gain further insight into any data set we are provided. So the question we want to answer to is: can we determine a movies’ commercial success based upon one or more of these metrics?
From a data science and analytical stand point, data wrangling helps us organise the data into manageable objects which are tidy, making the process of plotting information clearer and more concise, a fundamental purpose of data analysis. Once wrangled into a tidy format, and using just a few commonly used methods within data science, it’s possible to start pulling together findings which are present within our data. These methods include; exploratory analysis, first mapping variables of possible interest using scatterplots, graphs and tables to visualise any areas requiring further inspection, along with k-means clustering whereby we group subject (in this case, Movies) into clusters decided by their relative mean values across numeric variables (Budget, Revenue, Vote Count etc) to determine and define groups of similarity within our dataset based on these metrics.
Experimental Analysis, aiming to find areas of immediate interest
In order to point out areas of particular interest it’s worth creating some basic plots which are easy to interpret, this is also a good way for us to explore the structure and format of our data while recognising any immediate trends or patterns.
We started by looking at columns such as movie budgets, revenue, and movie genres. From the data, it was clear that there were 5 genres displaying high budgets and often higher returns in gross revenue, with ‘action’ movies excelling in this field, and are therefore most attractive in terms of investment for production companies. This can also be said for adventure and animation films.
Looking at how movie budgets and gross revenue differ depending on genre
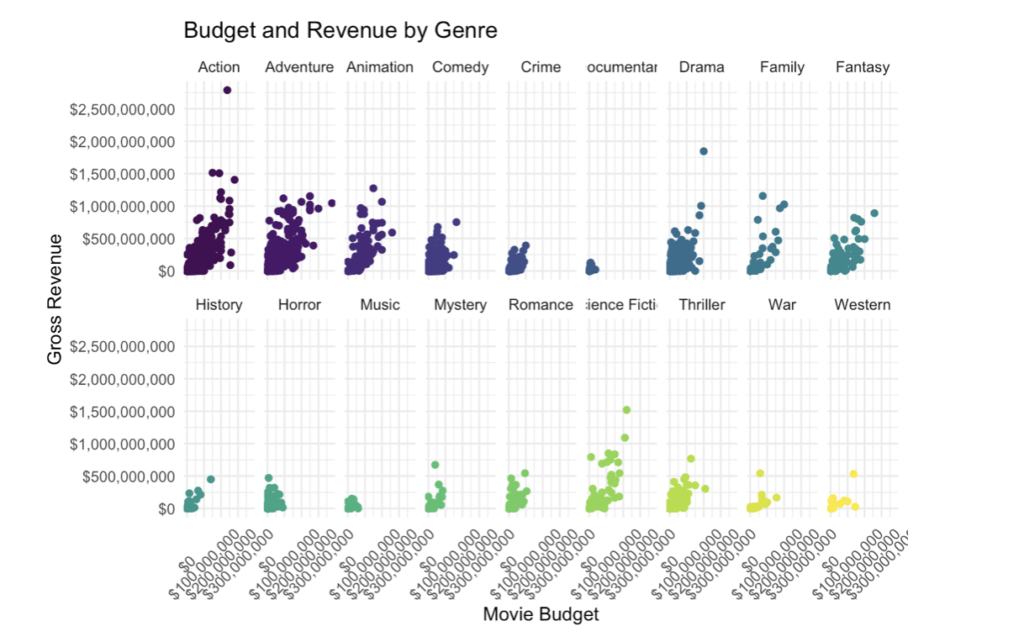
From these plots alone we can see that action and adventure (with the exception of some science fiction films) excel in terms of revenue, such movies require an initial upfront budget as seen by the second plot. Now we have an idea of what variables can be useful for telling a story about commercial success, whether it be gross revenues within each genre or something else.
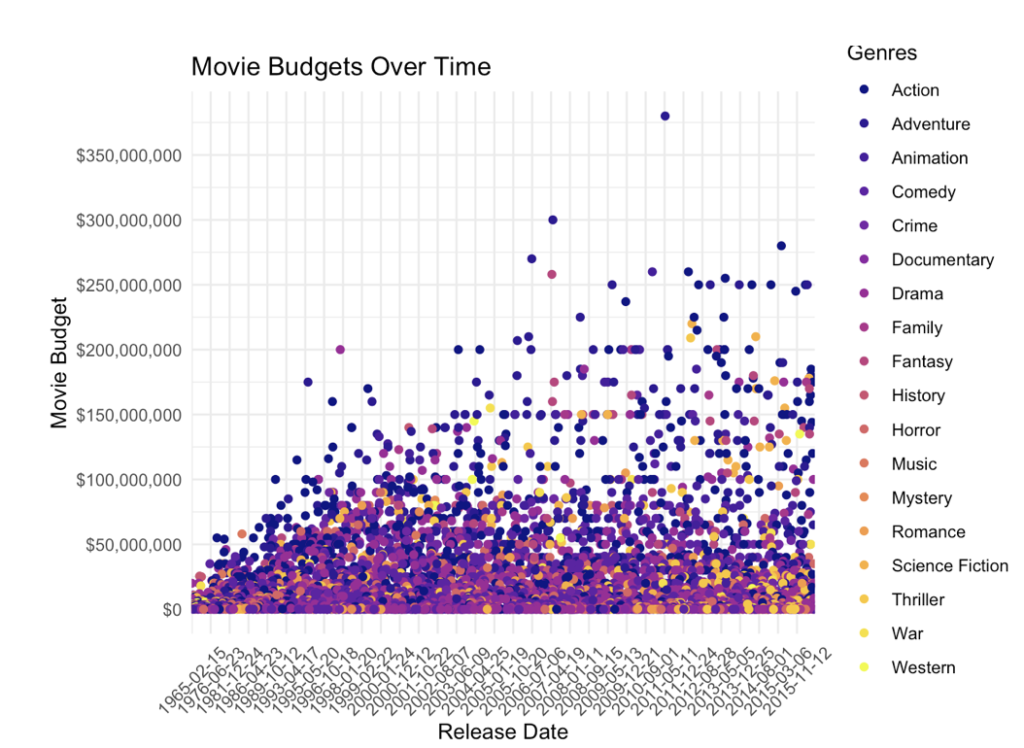
But another variable we found to be useful for analysis was ‘release date’ and the potential this had with gaining further insight by mapping other variables over time. For example, we looked at the change in movie budgets overtime, along with movie gross revenue.
Showing how have movie budgets evolved over time
Now, looking at how gross revenues have changed over time
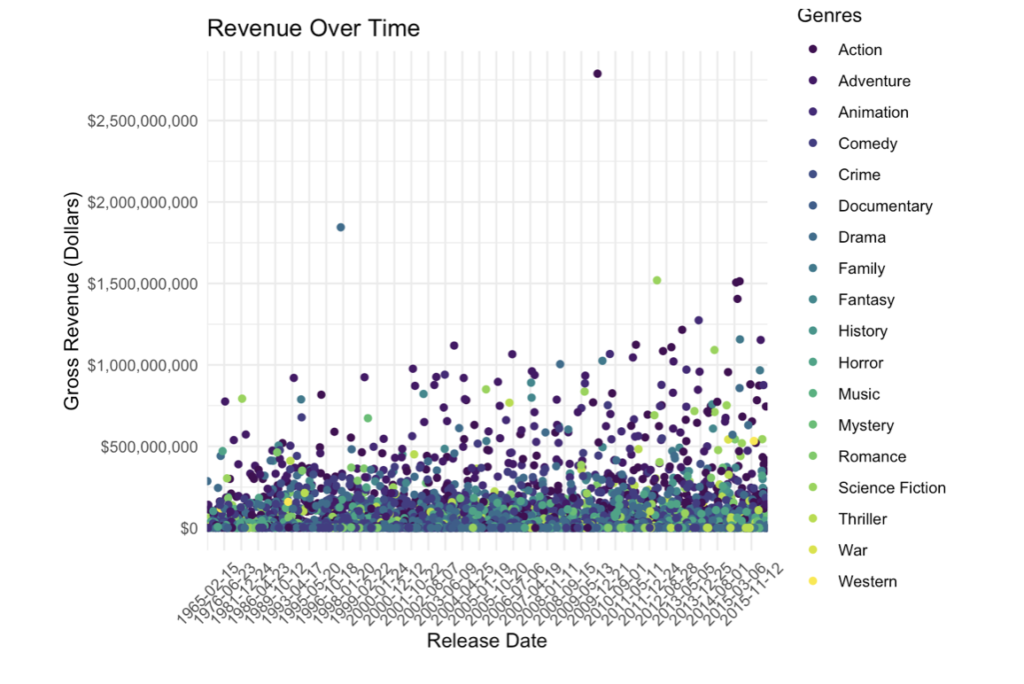
Now that we’ve seen the trend in budgets and revenue, it’s obvious that companies are seeing the benefit of investing large sums as they create even larger returns. But what does this mean for movie popularity among viewers, as time goes on and budgets and revenues become increasingly large, are movie fans also benefiting from these huge investments?
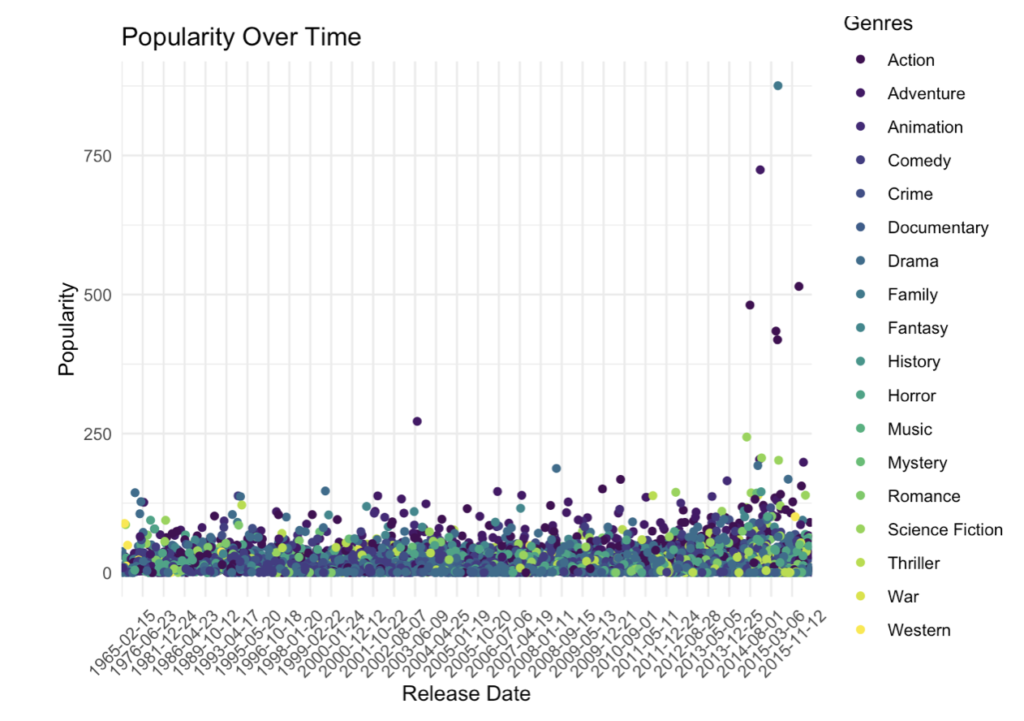
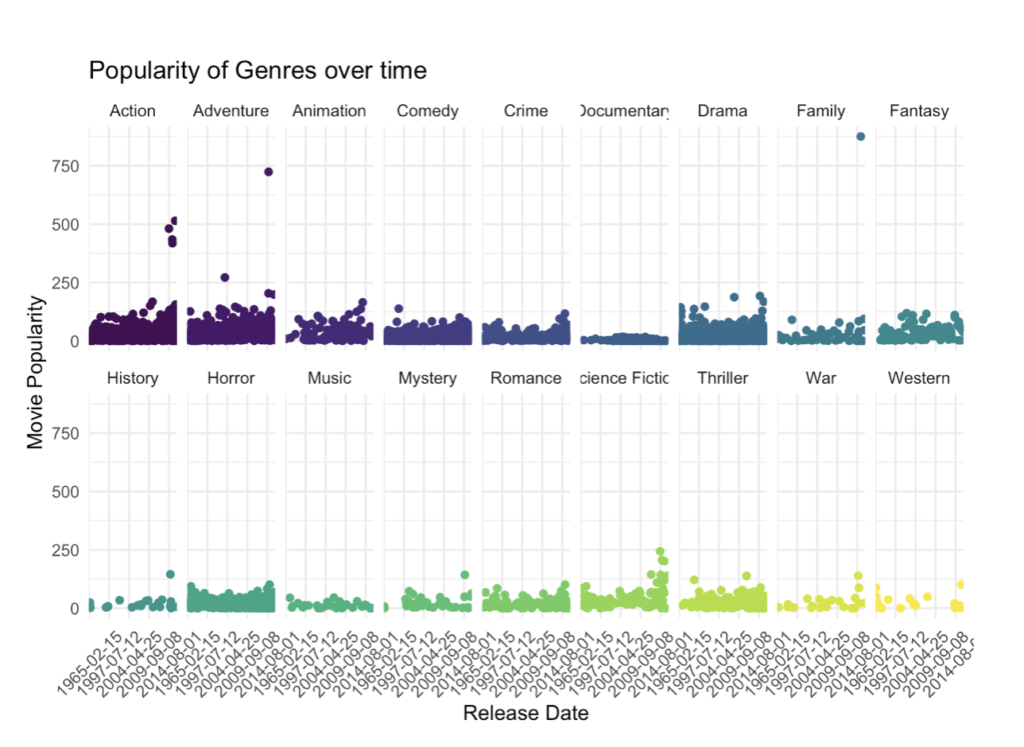
How have genre popularities developed over time?
Now looking at the same data but facetted, it’s clear to see the change in popularity of each genre over time, much clearer than the original scatter plot.
Thinking analytically, you can see that movies released post 2010 are becoming increasingly popular across all genres, possibly due to modern advancements in technologies such as CGI as well as costume and makeup improvements throughout the last few decades, all made possible by the increasingly large budgets movies receive.
But there’s more, looking at this plot one can observe a spike in popularity within the 1970s and 1980s across action, adventure, horror and sci-fi genres. And when we think about what movies were released throughout those two decades (Top Gun, The Goonies, A Nightmare on Elm Street, The Terminator and of course, Back to the Future), it’s not hard to believe what we see. The same can also be seen in the period of 1965-1975 with Western films, most likely a direct influence from Clint Eastwood and the iconic Western movies released during this time.
How do genres compare when looking at movie popularity and gross revenue?

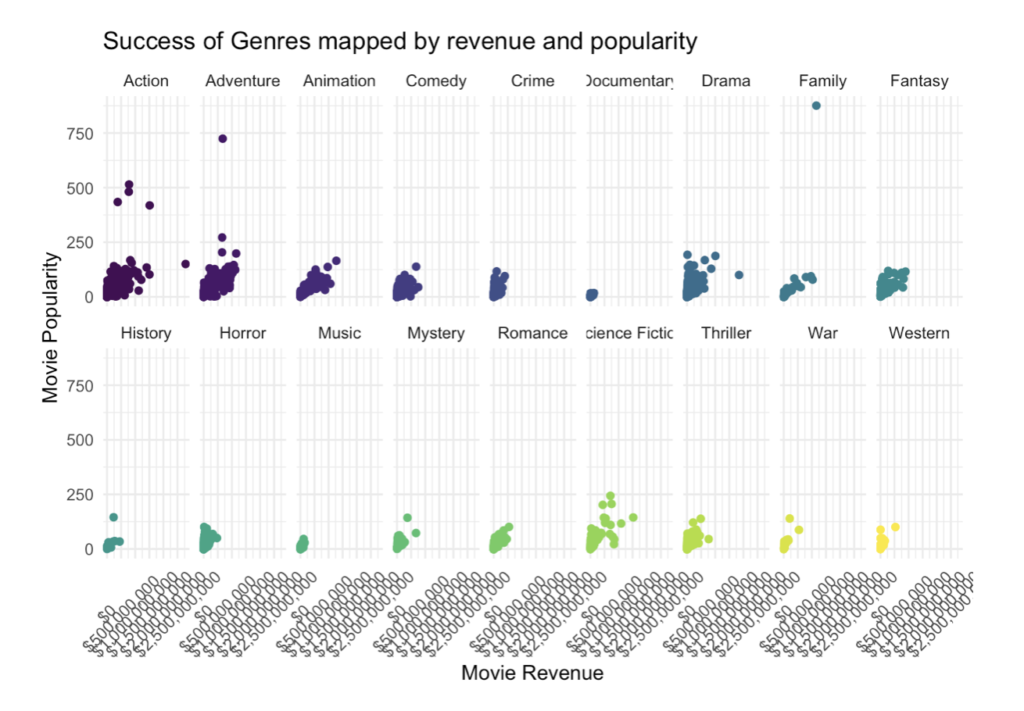
Now that we have looked at genre success over the years, how can we further analyse the same set of data and tell a more descriptive story? Can we identify what companies perform best overall?
With some more data processing and wrangling, we can create an object with the mean revenue, mean popularity and the number of movies released by each of the production companies.
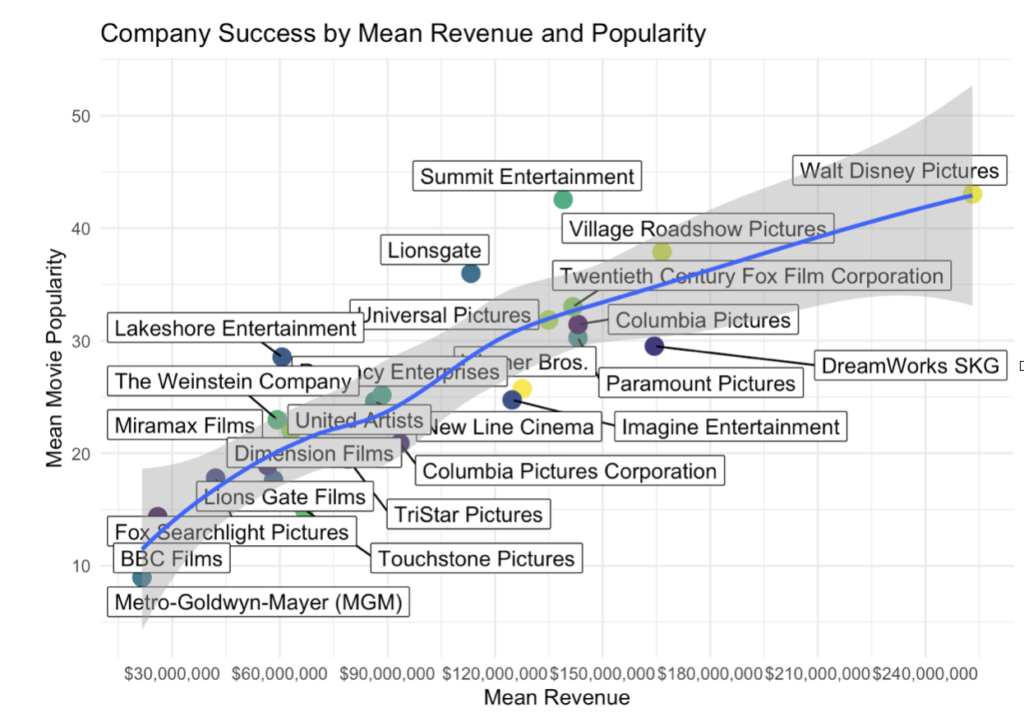
With the data wrangled and a new object created, we can now select the top 25 production companies based on volume of movies released. We can then use scatterplot to display the mean average scores of each production company across Revenue and Popularity metrics in order to outline any companies which are under performing or outperforming in comparison to a linear model (the blue line displayed in the plot below) which shows an average trend in terms of performance.
With a linear model displayed on the plot, we can start to see which companies have high means of revenue and popularity mapping their success by way of regression. Here we can understand that companies such as Walt Disney and Summit entertainment score exceptionally high in popularity across their released movies, receiving a high mean revenue in return. While companies such as Metro-Goldwyn-Mayer and Touchstone seem to be struggling in comparison.
Which production companies outperform or underperform when looking at mean popularity and revenue?
Now we wanted to use a more computerised approach to exploring the same content. K-means clustering, a mathematical algorithm that partitions (Movies) into groups byway of averaging mean scores of numerical (numbered) variables or characteristics. It is an unsupervised machine learning technique, which means it is done using super fast calculations which are accurate and well defined.
K-Means Cluster Analysis
Our next steps were to analyse the entire data set using a unsupervised machine learning technique called K-means clustering, whereby R can arrange each movie based on mean scores for the numerical variables such as budget, revenue, popularity etc, into clusters or groups of similarity. Before doing so, we needed to create a data object of these numerical variables, ready to run through the k-means algorithm. Once created, it was possible to plot the k-means cluster and observe the total of n/movies in each cluster and their relative mean values such as; average popularity, run time etc.
K-means cluster plot visualisation

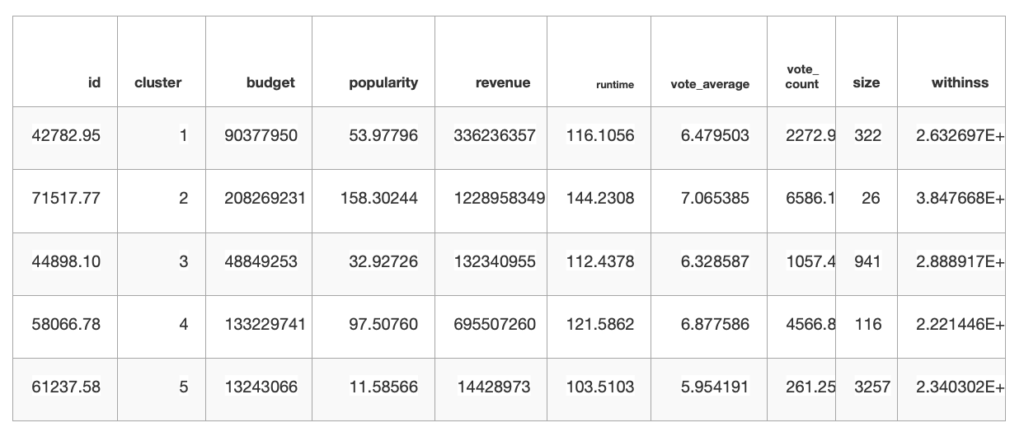
These mean values can be seen below, byway of plotting a table using package `kable`.
From this we can see what each cluster is in respects to this data. Cluster 5 being the most populated and with the lowest average scores for all of the metrics other than size. Cluster 2 seemingly the most ‘successful’ of the clusters, with high mean scores across all metrics, but with the smallest size of just 26 movies. Following cluster 2, cluster 4 containing just 116 movies and with a very respectable mean score across metrics such as revenue and popularity.
We also had some more observations. Noticeably, when focusing on ‘success’ of clusters (defined by mean popularity and revenue) it’s possible to see a correlation between cluster ‘success’ and run time. With the more successful clusters having a higher average run time, and this average value begins to descend as the clusters become less ‘successful’, scoring lower on all other metrics. Again, we can now start to tell a story about the likelihood of a movie’s ‘success’ based upon metrics displayed here.
Kable table displaying information created by the K-means statistical object
Now we have created a k-means cluster for movies based on their commercial success.
While all of this information is rather interesting, it’s unclear as to what movies exactly fit inside of each of the five clusters. So with a little bit of wrangling using code in R we can assign each of the movies within the data set to their respective cluster.
Once the original data frame has this information mutated onto it, it is possible to start plotting the frequency of movie count in each cluster by their genre category. Doing so, we can determine which genres are most likely to be included within each cluster, further developing an understanding of the commercial success of movies.
Which genres make up the proportion of films within each cluster?

So what did we do and what have we discovered?
What we’ve done here is, first experiment with some of the variables in order to find points of interest which may be calling out for further investigation. We figured commercial success was an area of particular interest so we proceeded to conduct an experimental analysis approach, we looked at budgets and revenues over time, noticing huge increases with both, along with movie popularity by genre which seemingly increased massively post 2010.
We then conducted a k-means cluster analysis containing all numeric data whereby each movie would be arranged by cluster depending on their scores for each metric, being assigned to the cluster with the nearest mean values. This helped us to identify between 5 groups of movies based upon all observation values for the numerical data chosen, and what we found was a noticeable correlation between budget, revenue, run-time and popularity of the movie. Finally, we analysed this data by way of jitter plot, painting a picture of the genre count within each cluster, this helped to identify the most over produced and under successful films by genre. We had found by looking at the jitter plot information that drama, comedy, action and horror films dominate this overproduced and under successful cluster of movies.
So what we have learnt overall, is that movies which exceed in terms of commercial success (overall popularity by vote and gross revenue) consist of a number of genres and are produced by a wide variety of companies. But with the application of some investigative measures we can say that action, adventure and animation triumph above all consistently, wheres companies such as Lionsgate, Summit Entertainment and Walt Disney outperform across these metrics. Now we can gather some idea about predicted commercial success based on a movie’s genre and the production company of which produced it. This is good insight when focusing on Lionsgate and Summit upcoming movies in genres; action and adventure, but perhaps nothing out of the obvious when looking at any animated movie being produced by Walt Disney Pictures.
We have barely scratched the surface when it comes to data science techniques and methodology, but by just using a select few we can gain huge insight and context from any one data set.
If you’d like to know more please reach out to our Junior Data Scientist, Tim, at tim.mooney@sharecreative.com
This article was also posted on DATA MAGAZINE