We’ve spoken a lot about the growth of the gaming industry in recent years. When the pandemic hit, people were left with a lot of free time and were on the look-out for ways to cure their boredom. But as games become more popular, people become inspired to collect data about their favourite games and with this we can create visualisations to identify new insights. Back on the 19th November, Pokémon re-released Diamond and Pearl and we thought there was no better time to investigate Pokémon data to see what we could find. The dataset used contains an abundance of details about each Pokémon including their type, strength of attack, and their height enabling us to use the R programming language and creativity to explore this information.
Damage against Types
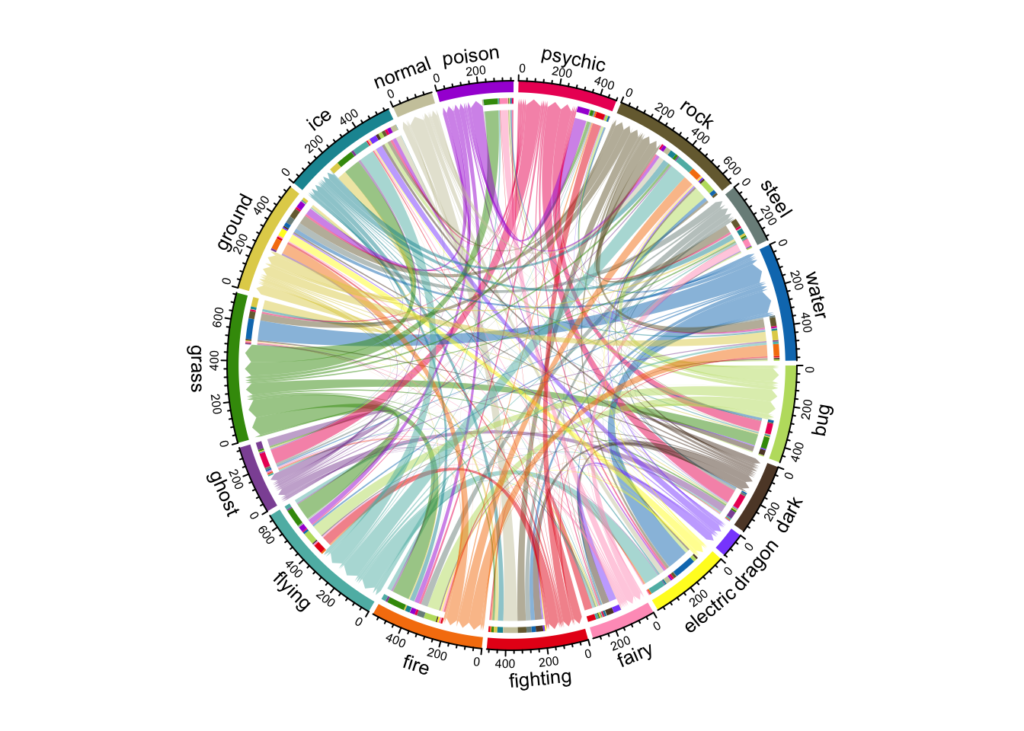
Pokémon can be one of many types, including fire, ice, and rock. The type of the Pokémon affects how strong or weak they are against another type. In the chord plot below, we have visualised the number of Pokémon of one type that can inflict significant damage against another type, significant meaning damage of over 1. Arrows pointing from one type to the other indicate them inflicting damage, arrows pointing to one type indicate them taking damage. Essentially, the wider the arrow, the stronger one type of Pokémon is against the other.
Some observations include:
- If you wanted to tackle a water Pokémon, you’d go for an electric or grass one, whereas if you wanted to tackle a flying Pokémon, you could go for rock or ice.
- Looking at the number of threads to and from each type, electric and fire could be considered two of the strongest types, whereas rock and ice could be considered two of the weakest.
Normal and dragon types aren’t strong against any type (although this isn’t strictly true – dragon types are strong against themselves).
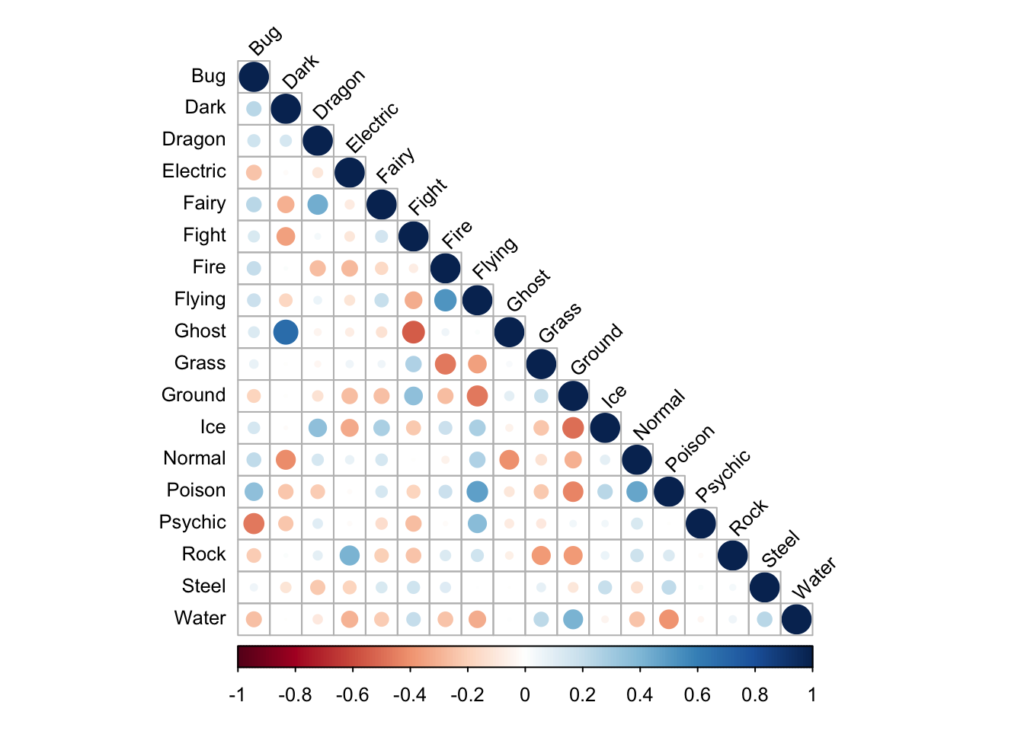
Another way to visualise damage between types is to see how correlated the damage variables are for each type. A high correlation essentially means the Pokémon will inflict a similar amount of damage on the two types, whereas a low correlation means that the Pokémon will inflict different amounts of damage on the two types.
The highest correlation between two types is between ghost and dark types, i.e. Pokémon that inflict damage on ghost types tend to also inflict damage on dark types.
Total Points
Pokémon have a range of metrics which can be combined into a total score. This score indicates how well they will do in a battle. The base total is calculated using:
- Attack
- Defence
- Special Attack
- Special Defence
- Hit Points (HP: how much damage a Pokémon can take before fainting)
- Speed
For the top 6 most populous Pokémon types, let’s see how these metrics differ with the density plots below. The further the hump is to the right, the better that type of Pokémon tends to perform on that metric. Conversely, the further the hump is to the left, the worse that type of Pokémon tends to perform on that metric.
We can see that psychic Pokémon tend to perform well on all metrics except for attack, fire Pokémon aren’t great at defence, and bug Pokémon don’t do much better than any other types on any metric.

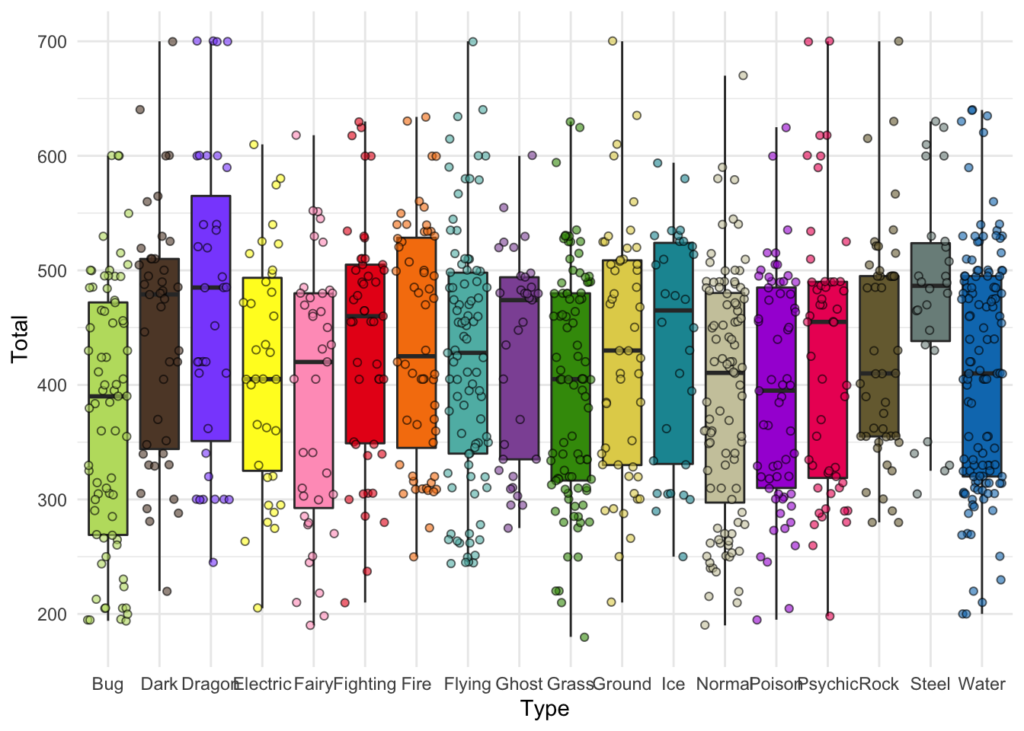
The boxplot below shows the range of the base total scores for each type of Pokémon, along with individual scores. The black line in the middle of each box indicates the average total for that type – the higher this line, the better the Pokémon of this type tends to be.
Steel-type Pokémon have the highest average total and a small range of values, making it the best type to have. Unfortunately there aren’t many of them, so they might not be the best to pin your hopes on. Instead, consider choosing a dragon or ghost type.
Team Building
Whilst it’s interesting to see how abilities differ across each type, it’s not the only thing that affects their performance. A player may find it more useful to find groups of Pokémon with similar abilities so that they can organise teams. One way of finding similar Pokémon is to perform clustering analysis – a way of finding natural groups within data by observing similarity in their attributes. The type of clustering algorithm used is called K-means, which finds groups by minimising the distances between the observation and the centroid of their group.
We’ve split the Pokémon into 6 groups using the following metrics:
- Attack
- Defence
- Special Attack
- Special Defence
- Egg steps (how many steps it takes for the Pokémon egg to hatch)
- HP
- Speed
Once the Pokémon have been grouped together we can investigate how the metrics differ. For example, group 3 Pokémon seem to be the fastest, group 1 Pokémon have strong attack, and group 5 have strong special defence.
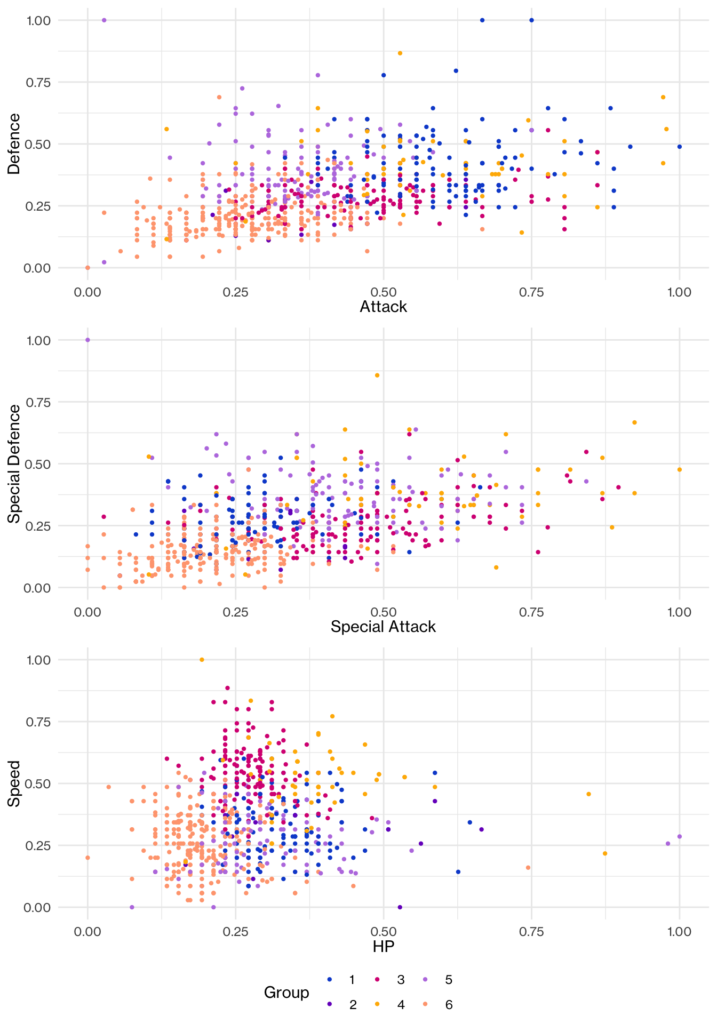
However, these plots don’t include the egg steps metric, and it’s perhaps easier to visualise the strengths within each group by plotting the mean for each metric, seen below.
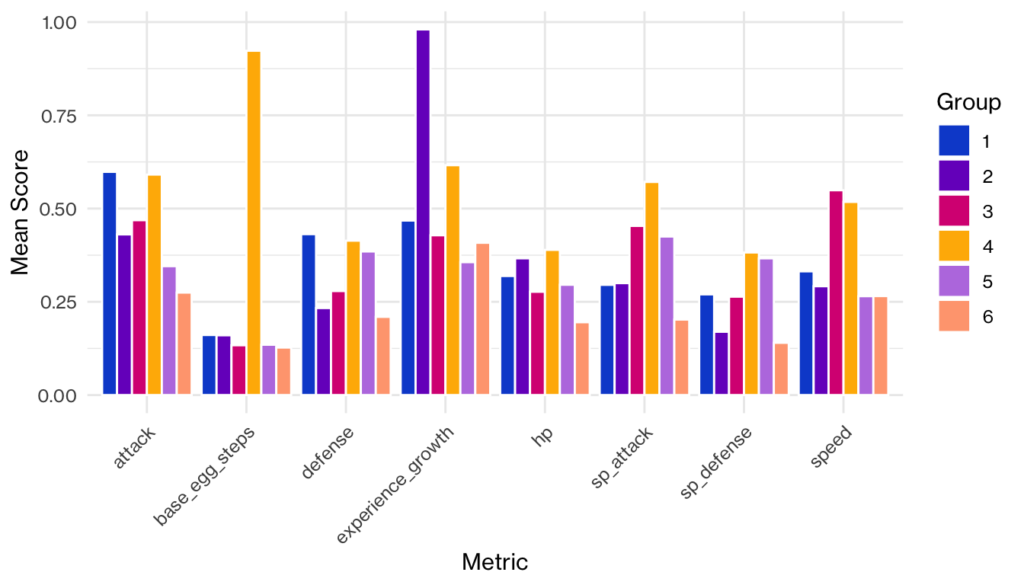
Group 1

Use these if you want Pokémon with high attack and defence. These include Luxray, Barbaracle, and Dragonite.
Group 2

Use these when you want Pokémon to last longer in battle, but be warned that they take a long time to level up. These include Drifblim, Hariyama, and Munchlax.
Group 3
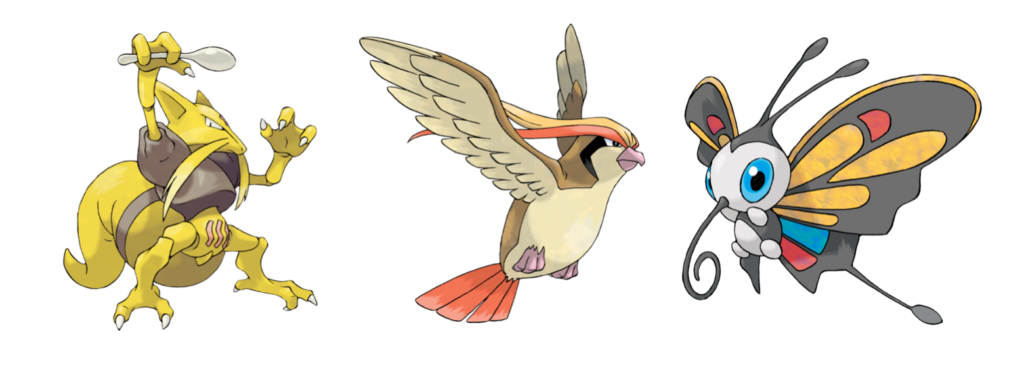
Use these when you want fast Pokémon that have powerful special attack. But be aware that on most other metrics these Pokémon don’t perform well. These include Kadabra, Pidgeot, and Beautifly.
Group 4

These Pokémon take a really long time to hatch but they perform well on virtually all other metrics. These include Buzzwole, Mewtwo, and Volcanion.
Group 5

These Pokémon defend well, both normal and special, and don’t take too long to level-up. These include Mr Mime, Blastoise, and Hypno.
Group 6
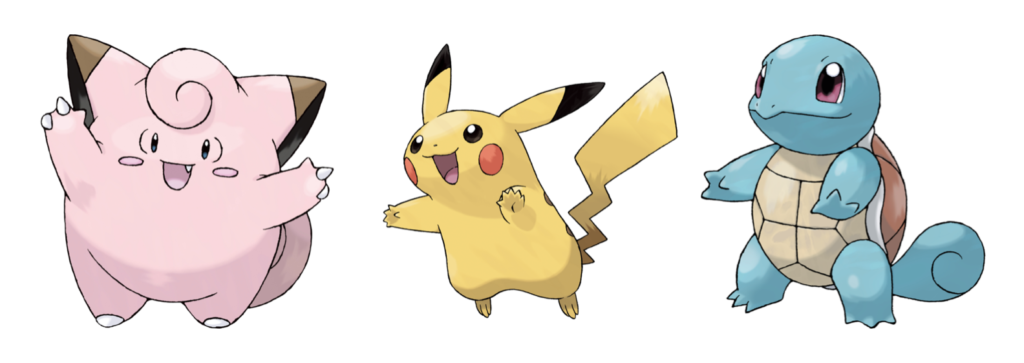
Finally you have your cute ones where they don’t perform particularly well on any of the metrics, but they don’t take long to hatch. These include Clefairy, Pikachu, and Squirtle.
These visualisations only scratch the surface of what stories data can tell you. If you’d like to know more please email our Data Scientist, Rose, at rose.pegler@sharecreative.com